How I Scaled an Apparel Ecom Brand from $5k to $2m on Google Ads

By Santosh Kumar, Founder of Shopiator
How I scaled an apparel ecom brand on Google Ads to $641k in spend and $2.01m in revenue at 3.14 ROAS, with month-by-month spend, the brand vs non-brand split and the ROAS caveats most case studies hide.
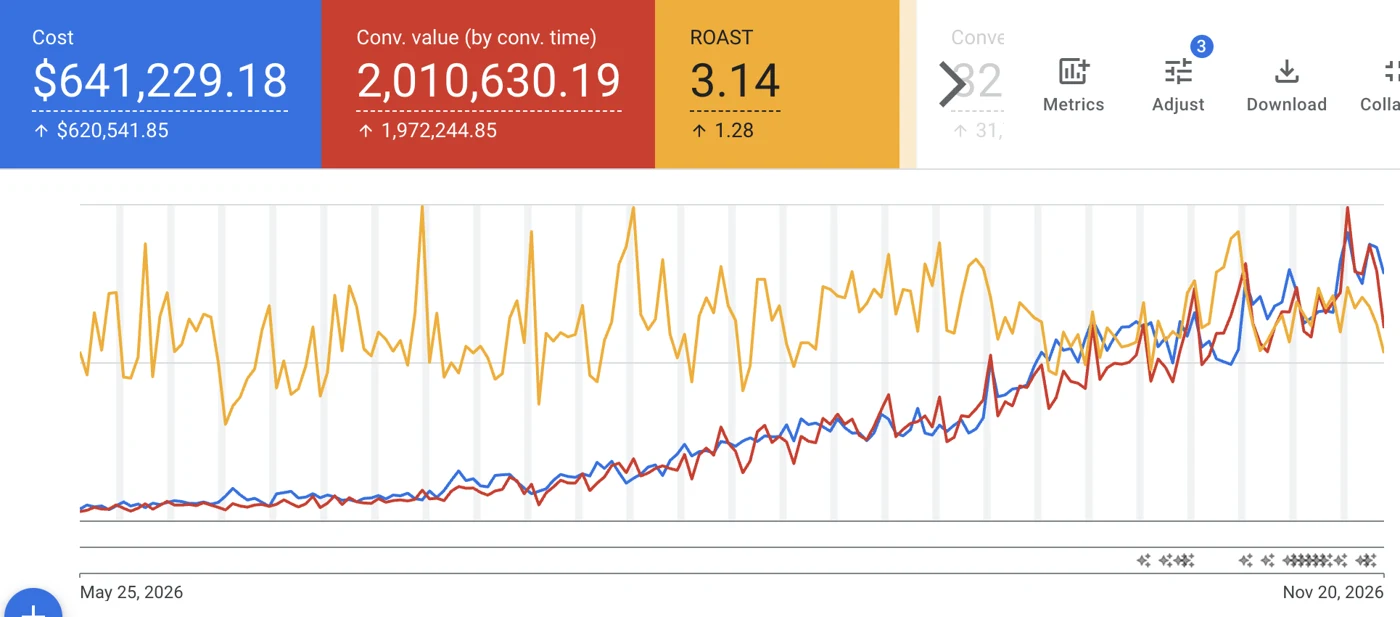
Before the comments start: $5k is roughly where spend started (the account spent $8k in April, and $3.9k in the first week of my window). $2m is the revenue Google Ads tracked in the six months since, measured by conversion time. It is not ad spend.
What are the numbers behind $5k to $2m?
- ▶Ad spend: $641,229 (May 25 to November 20, 2026)
- ▶Conversion value (by conversion time): $2,010,630
- ▶ROAS (by conversion time): 3.14
- ▶Orders: 32,353 conversions
How did spend and ROAS move month by month?
| Month | Spend | Revenue | ROAS |
|---|---|---|---|
| March | $673 | 0.61 | |
| April | $8,054 | 1.45 | |
| May 1 to 24 | $11,960 | 2.20 | |
| May 25 to 31 | $3,936 | $11,083 | 2.82 |
| June | $24,519 | $63,010 | 2.57 |
| July | $38,684 | $108,117 | 2.79 |
| August | $76,795 | $239,357 | 3.12 |
| September | $113,454 | $386,621 | 3.41 |
| October | $206,927 | $635,801 | 3.07 |
| November 1 to 20 | $176,913 | $561,557 | 3.17 |
Source: Google Ads API, all campaigns, conversion value by conversion time, pulled November 21, 2026.
Spend grew about 8x between June and October, and ROAS did not fall. It rose from the high 2s to the low 3s. I won't pretend it was above 3x from day one: June and July ran at 2.6 to 2.8 while the account was small. The current pace is about $10k a day.
What was the brand vs non-brand split?
Brand search was 9.6% of spend across the six months. I count pure-brand search and brand Shopping campaigns as brand.
| Spend | Share of spend | ROAS | |
|---|---|---|---|
| Brand | $61,727 | 9.6% | 12.01 |
| Non-brand | $579,503 | 90.4% | 2.19 |
Source: Google Ads API, conversion value by conversion time, May 25 to November 20, 2026.
Two things to say plainly, because someone will find them anyway. First, the blended 3.14 is lifted by brand. Non-brand, the cold traffic that actually finds new customers, ran at 2.19. The client's targets were 2x on cold traffic and 3x blended, and that is what I scaled against. Second, brand share moved: it was 14% of spend in September and about 10% over the last 30 days. The six-month figure is under 10%.
Why does brand share matter?
Brand traffic is people who already know the store. Money there looks efficient because those shoppers were going to buy anyway. A 4x ROAS that is 60% brand tells you almost nothing about whether the ads find new customers. Here, brand was under a tenth of spend, so nine dollars in ten went to people who had not already decided to buy.
Why measure ROAS by conversion time?
The default Google Ads view credits revenue to the click date. Conversion time credits it to the day the sale happened. Recent weeks look worse in the click-date view because of conversion lag, so every number here is by conversion time.
How did I scale it without breaking ROAS?
- ▶Brand and non-brand were never mixed. Brand sits in its own capped search and Shopping campaigns. Brand exclusions are attached to the cold Performance Max campaigns so they cannot quietly harvest brand traffic.
- ▶One campaign set per country. US, UK, Canada and Australia run separate campaigns, because a Canada campaign at 1.3x was hiding inside results at 3x.
- ▶Cold traffic was judged on its own number. Every budget decision used cold ROAS, not the blended one that brand flatters.
- ▶Budget steps of 10 to 20%, only when 7, 14 and 30-day ROAS all hit target. Scaling on one good week is how accounts blow up.
- ▶Channel mix was checked weekly. When a Performance Max campaign drifts into Gmail or Display and ROAS drops, I move the spend before the monthly report shows it.
- ▶Brand bids were capped, so I never pay Google a high price for traffic that would have clicked anyway.
What did I choose not to do?
Spend is the easiest number to inflate. If the client had accepted a ROAS near 1x, I could have pushed spend far higher, the way some agencies do. The client wanted profit, so the floor stayed where it was.
Which questions should you ask any agency showing you a result?
- 1.Is that spend or revenue?
- 2.What is the spend, month by month?
- 3.What share is brand, and what is non-brand ROAS on its own?
- 4.Is the ROAS by click time or conversion time?
- 5.How many of those orders were new customers?
Frequently Asked Questions
Is the $2m revenue or ad spend?
Revenue tracked by Google Ads, measured by conversion time. Ad spend was $641,229 from May 25 to November 20, 2026.
How much of the spend was brand search?
9.6% across the six months ($61,727 of $641,229), at 12.01x ROAS. Non-brand ran at 2.19x. Brand share was higher in September (14%) and about 10% over the last 30 days.
Was ROAS above 3x the whole time?
No. It was 2.57 in June and 2.79 in July while spend was small. From August to November it ran between 3.07 and 3.41 as monthly spend grew from $77k to $207k.
Is the ROAS measured by click time or conversion time?
Conversion time. Every figure in this post uses conversion value by conversion time, which credits revenue to the day the sale happened.
Can you do this for my store?
I take on a small number of ecom brands at a time. You can join the waitlist at shopiator.com/waitlist.
Want the operator to check this on your account?
The Operator Audit is a full manual review of your account: 10 recommendation sets, a live findings call and a prioritized action plan. The $1,299 comes off your first month if you hire us within 30 days.
Keep reading
Google Ads MER vs ROAS and Incrementality: Settle the Argument
Google Ads attribution says it's working, your MER says it isn't. Why both can be wrong, and the test that settles it before you fire anyone.
ReadGoogle AdsGoogle Ads Promotion Mode for Ecom Brands in Q4: A Playbook
A Q4 playbook for ecommerce stores on Google Ads Promotion Mode: how to get it, set it up, time it around Black Friday and keep the sale profitable.
ReadGuideCova Bundles vs Kaching Bundles: Pricing, Features and Which to Pick
Cova Bundles vs Kaching Bundles compared from live Shopify App Store listings: pricing by revenue tier, features, review base, merchant complaints and which bundle app to pick for your store.
Read